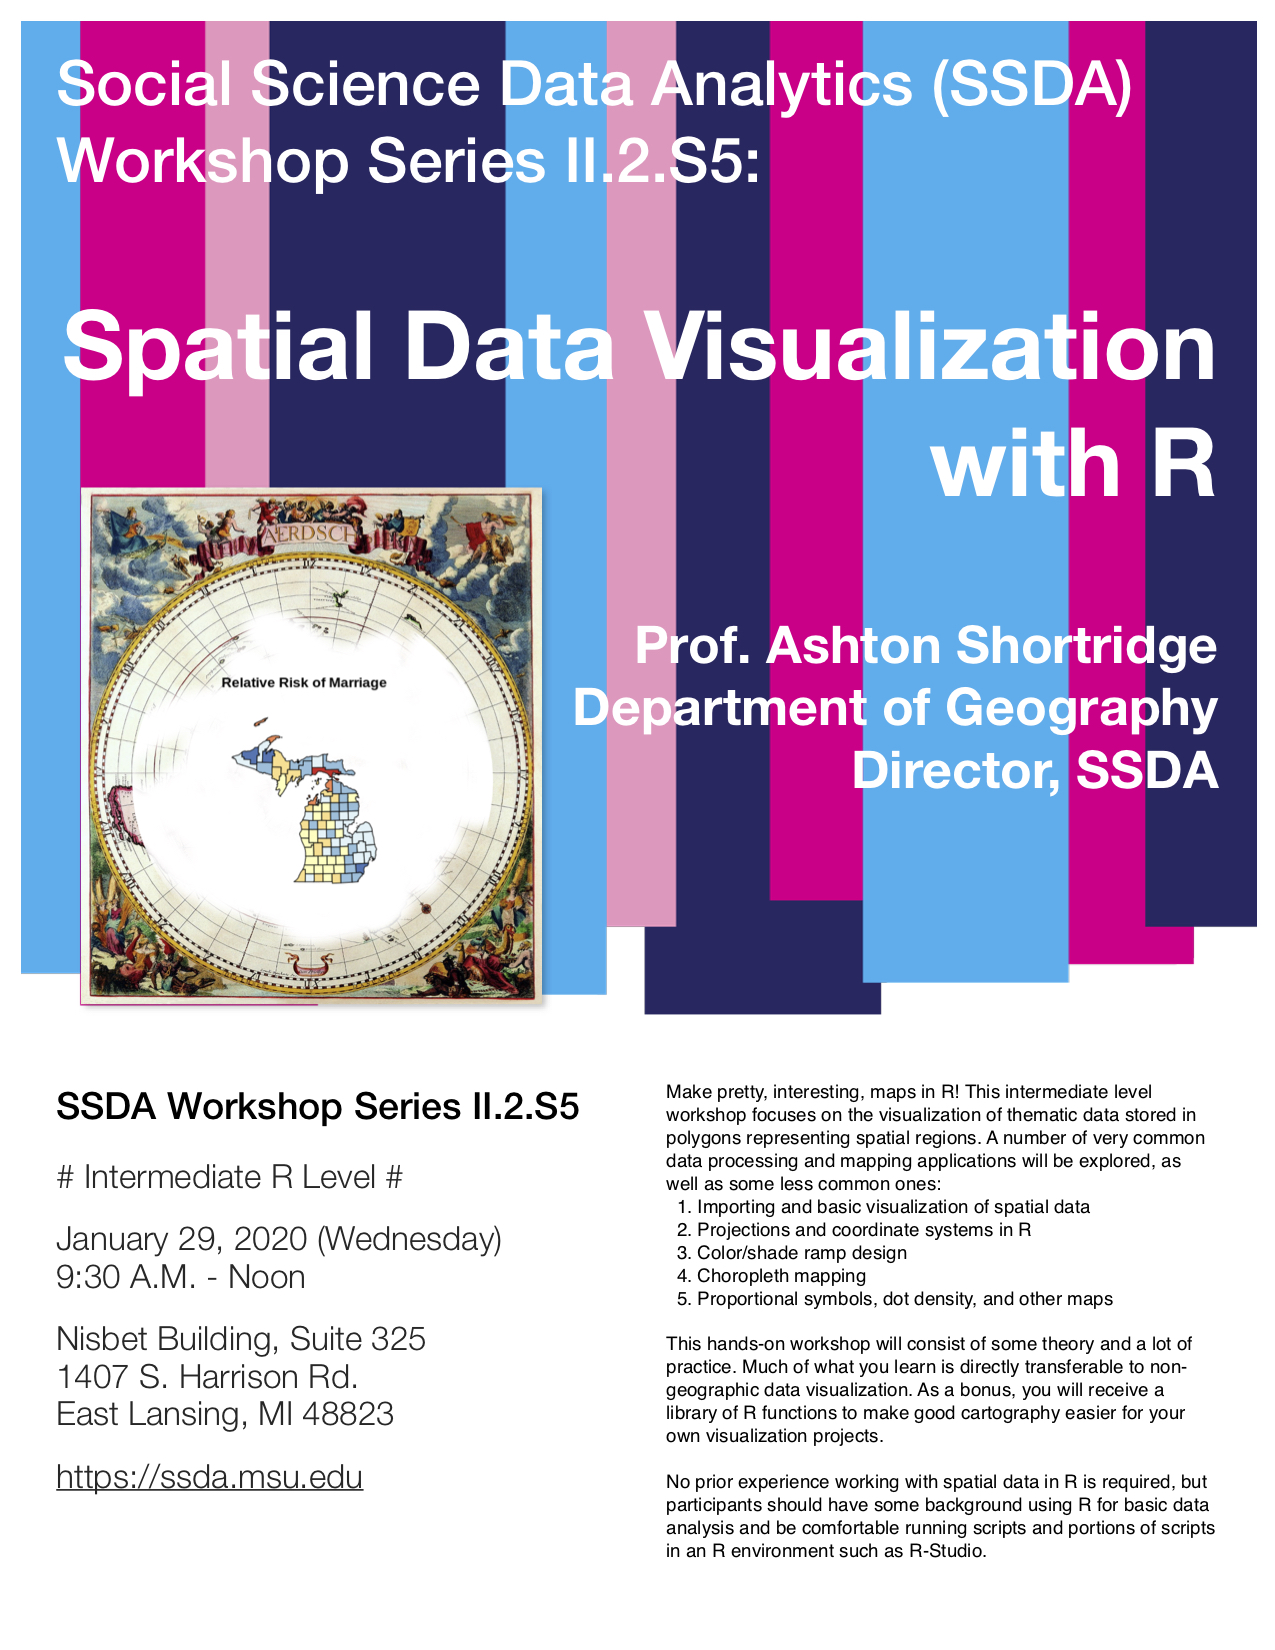
Spatial Data Visualization with R
Wed, January 29, 2020 9:30 AM - Wed, January 29, 2020 12:00 PM at Nisbet Building, Suite 320, Michigan State University
Make pretty, interesting, maps in R! This intermediate level workshop focuses on the visualization of thematic data stored in polygons representing spatial regions. A number of very common data processing and mapping applications will be explored, as well as some less common ones:
- Importing and basic visualization of spatial data
- Projections and coordinate systems in R
- Color/shade ramp design
- Choropleth mapping
- Proportional symbols, dot density, and other maps
This hands-on workshop will consist of some theory and a lot of practice. Much of what you learn is directly transferable to non-geographic data visualization. As a bonus, you will receive a library of R functions to make good cartography easier for your own visualization projects.
No prior experience working with spatial data in R is required, but participants should have some background using R for basic data analysis and be comfortable running scripts and portions of scripts in an R environment such as R-Studio.
- Time: 9:30 A.M. - 12:00 P.M., January 29, 2020 (Wednesday)
- Location: Suite 320, Nisbet building
- Registration: RSVP by January 24, 2020 (Friday)
- Parking: Both meter parking and permit parking available
- Bring: Your laptop


